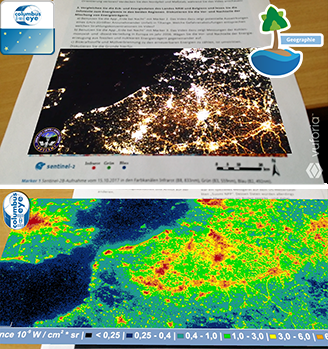
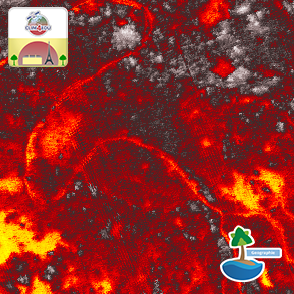
All working sheets are based on the videos we receive from the ISS. They transfer complex aspects such as e.g. Rayleigh scattering (Physics). Besides exercise sheets the zip-files contain background information as well as didactical commentaries. Additionally, there are slides and PowerPoint files with small flash animations.
The Observatory deals with topics in geography. These are interactive tools which contain panoramas from ISS-overflights of different regions on our Earth including Sahara, South America and Canada. Besides regional geography pupils get active by themselves and create an own map out of the ISS-image by using classification techniques.
The learning modules are based on ideas generated in the partner project Remote Sensing in Schools. They combine processing tools of image analysis with technical exercises and interactive animations. Pupils develop topics of the curriculum using methods of earth observation and get into the world of data behind the fascinating images.
The retreat of the Aral Sea and subsequent development of the Aralkum desert is one of the most impressive examples for desertification of our time. The work sheet “Aralkum – A Lake Disappears” demonstrates the development of the region in the past 10 years using ISS videos, satellite imagery and background information about the societal and economic processes. The students slip into the role of scientists researching the area and predicting the Aralkum’s future development with the “Aralkum – A Lake Disappears”- app.
App “Columbus Eye”, free of charge on the Google Play or the App Store:
Part “Aralkum”
Students shall…
The work sheets contain material about the formation and classification of various types of deserts, both from the climate and the geomorphological perspective. The video “Desert of the Earth” shows the various desert types from the view of the International Space Station ISS. Pupils learn to classify those types with climate graphs and other materials. The topic of desertification is subsequently demonstrated by the example of the Aral Sea and the massive impact of the process both on humans and the environment.
The pupils should…
• Interpret satellite images and allocate them geographically,
• learn how to link geographical information wisely with each other,
• learn to distinguish differently sized deserts according to their
characteristics
• learn how to interpret climate graphs independently,
• understand the genesis of different desert types
While air pollution in central Europe is well documented and many counteractions have been taken by politics, light pollution is barely considered by the public. This teaching material contains satellite images and an ISS video demonstrating the effects of light pollution. Two neighbouring regions with different approaches to night-time lighting are compared, both in regards to reasons and impacts. Natural conditions and settlement structures are discussed in this context, as well.
App “Columbus Eye”, free of charge on the Google Play or the App Store:
Part “Earth by Night”
The pupils are to…
How does the Moon influence the Earth – and the other way round?
What would happen if the Moon was so much closer to the Earth – or further away?
And why do we see the Moon’s shadow so rarely?
The worksheet “From the Earth to the Moon and Back – Gravitation in the Earth-Moon system” and its app lets pupils experiment with the distance between the Earth and the Moon. The pupils’ smartphones become the Moon so they can experiment from their “position in space” what would happen if they came closer to Earth – both on the Earth and the Moon. The Moon shadow simulation and the video of the Moon from space help to understand why Solar and Lunar eclipses are so rare and give an understanding of the vast distances in space.
App “Columbus Eye”, free of charge on the Google Play or the App Store:
Part “Earth-Moon System”
The pupils are to…
• realise the effects of differential gravitation,
• realise interactions in the earth-moon force system,
• chose physical values reasonably and deductively process them in a hypothesis,
• perform a thought experiment.
The zip file (2 MB) contains the work sheet with the Augmented Reality markers, teaching materials with lesson plans and master solutions, the marker image “Earth”, and additional information on the physical, mathematical and geographical background.
Grades 9-10
Already today, there are more and more heat waves, which are a burden for people living in cities. Older people in particular suffer, and for some it has life-threatening consequences. Against the background of climate change and forecasts that two thirds of the world’s population will live in cities by 2050, the urban climate is a current and relevant topic.
Paris is one of the most severely affected cities in Europe. Summer nights here are up to 4 K warmer than in the surrounding countryside. During the heat waves in the summer of 2022, Paris was hit particularly hard by the heat, but projects are already underway to reduce the problem by converting traffic areas into green spaces.
The work sheet and the app use satellite images with true colours, plant cover and surface temperatures to take a closer look at the causes of the Urban Heat Island Paris and, based on this, discuss planned and implemented measures against it.
App “Columbus Eye” free of charge at Google Play or in the App Store:
Part “Summer in Paris”
Objectives: The students…
The Earth Marker works with several app parts:
Off to the Moon!
Explore the Moon through the lenses of various satellites and learn about some interesting places – even the hottest contender for the first permanent moon base!
Earth-Moon System
Do you really know where the Moon is? It’s further away than you think! But try for yourself when your smartphone becomes the Moon and you have to try out how far away you need to put it to be to scale (hint: it’s ~360,000 to 400.000 km away)
Satellite Systems
Europe alone has more satellites observing the Earth than can realistically fit into this app, so it only contains the most important ones, like the Copernicus Sentinels and the International Space Station – the largest Earth Observation satellite in space! This app will also help you understand why orbits are wavy lines on maps when you compare them with their 3D counterparts.
App “Columbus Eye” free of charge at Google Play or in the App Store:
The work sheet explains the formation of tropical cyclones by taking the example of typhoon Maysak, which afflicted the Phillipines on 5th of April, 2015. Schematic representations, ISS videos, and weather maps illustrate the formation and structure of tropical cyclones. The work sheet is enriched by a so-called Augmented Reality application. Combined with the paper-based worksheet, the App “Eye of the Cyclone” allows pupils to watch typhoon Maysak live on their smartphones.
App “Columbus Eye”, free of charge on the Google Play or the App Store:
Part “Eye of the Cyclone”
Aims: The pupils shall be able to…
The ZIP folder (1 MB) contains work sheets and sample solutions.
When opening the tool “Canada”, the ISS-panorama will appear, showing the region Saskatchewan and the almost fully frozen Tobin Lake. Moving eastwards you will spot the Lake Winnipeg as well as partly ice- and snow-covered regions until you reach Fjord Saguenay in the east, located north of Québec. A video of formerly 9 minutes – the time it took for the ISS to fly over this region – was used to create this panorama.
Application (start/close)When opening the tool “South America”, the ISS-panorama will appear. It shows the coast of Chile in the west, bordering the pacific as well as the Andes Mountains with snow cover and the pampas, when navigating inland. The panorama was created out of a video of a 5-minute overflight of the ISS crossing the depicted area.
Application (start/close)The ISS flight above Western Africa shows an unique portrait of the Earth’s biggest desert: the Sahara. It shows the huge dimensions of the enormous and hot drylands. But it also includes the more vivid Savannas in the adjacent neighborhood. While there is nearly no life in the Sahara, you can find here seasonal blooming regions and even agriculture. Perhaps, you can detect the Eye of Africa or the ship graveyard of Nouadhibou.
Application (start/close)To be updated.